Concordance‑guided multilocus phylogeny of auger snails (Terebridae) reveals a robust backbone amid pervasive gene‑tree conflict.
Published on: July 2025
Introduction
A multilocus, genus‑wide dataset for Terebridae is assembled by mining GenBank for four commonly sequenced markers: mitochondrial cytochrome‑c‑oxidase subunit I (COX1), 12S and 16S ribosomal RNA, and nuclear 28S rRNA. After filtering for sequence quality and correct taxonomic assignment, our matrix comprises 125 species and more than 4,500 accessions. Maximum‑clade‑credibility (MCC) gene trees are inferred for each locus and reconciled with ASTRAL‑III to obtain a species tree that explicitly accommodates gene‑tree heterogeneity. Quartet‑sampling statistics, local posterior probabilities (LPP), and gene concordance factors (gCF) provide branch‑by‑branch measures of support versus conflict.
The goals of this study are three‑fold:
- Resolve inter‑generic relationships within Terebridae using a coalescent‑aware species‑tree framework.
- Diagnose and remove rogue taxa whose placement is demonstrably unstable or erroneous, yielding a curated reference phylogeny for downstream comparative work.
- Provide a transparent, reproducible bioinformatic pipeline and an annotated dataset that serve as the molecular foundation for our CNN‑generated tree.
Methods
Taxon sampling and sequence data
Four molecular markers (mitochondrial COX1, 16S and 12S rDNA, and nuclear 28S rDNA) were compiled for Terebridae by downloading all available sequences from GenBank (accessed June 2025). After filtering for completeness and quality, our dataset included 125 species totaling 4,500+ unique accessions across the four loci. An accession‑to‑species lookup table was built [1, 2].
Gene‑tree concatenation and species mapping
The four per‑locus Newick files were concatenated into a single gene‑tree set, with one tree per line. The accession→species map was filtered to include only those accessions present in these trees and an ASTRAL mapping file (-a) was written.
Species‑tree inference with ASTRAL
ASTRAL‑III v5.7.8 was used [3] to obtain local posterior probabilities (LPP) via -t 2, annotating each branch with quartet concordance (q1,q2,q3), effective number of loci (EN), and local posterior (pp1). Default equal weighting was retained. EN (“effective number of loci”) is the sum of per‑gene quartet weights and approximates how many gene trees actually contribute informative quartets to that branch (range = 1 to the total number of loci).
Gene‑concordance‑factor (gCF) analysis
Gene‑tree concordance factors were computed with IQ‑TREE 2.4.0 (Linux x86_64, AVX512 build dated 12 Feb 2025). The MCC species tree inferred from the pruned ASTRAL analysis was supplied as the reference topology, and the four locus‑specific MCC gene trees were passed as a multi‑Newick file (one tree per line).
Results
Dataflow and creation of the phylogenetic species tree
To infer a robust species phylogeny for Terebridae, maximum‐clade‐credibility gene trees are first generated for four markers—mitochondrial COX1, [1] 12S rDNA, 16S rDNA, and nuclear 28S rDNA—using BEAST2 [2]. These locus‐specific MCC Newick trees were combined into a single file and supplied to ASTRAL‑III with that file (one tree per line) plus a tab‑delimited mapping of each accession to its species. Running ASTRAL with the –t 2 option produced a fully annotated species tree (Figure 1) in which every internal branch is labeled with quartet concordance scores (q1, q2, q3), raw quartet counts (f1, f2, f3), local posterior probability (pp1), total quartet count (QC), and effective number of genes (EN). A full annotation was produced (parameter -t 2), see here
The unpruned ASTRAL tree recovers 12 genera and 125 species. Well‑supported monophyletic clades include Terebra (30 spp.), Oxymeris (10 spp.), Myurella (18 spp.), Neoterebra (9 spp.), and Myurellopsis (7 spp.), all with pp1 > 0.9. However, several genera are rendered non‑monophyletic: Duplicaria (6 spp.) splits into two groups, with D. bernardii nesting within Partecosta; Partecosta (5 spp.) itself appears in two distinct subclades; Profunditerebra (4 spp.) is embedded within Punctoterebra (15 spp.); and Maculauger (4 spp.) has M. minipulcher falling inside the Myurellopsis radiation. Only taxa whose placements matched their nominal genera were carried forward.
Removal of Rogue Species and Updated Tree
Six rogue taxa — Duplicaria tristis, D. bernardii, Partecosta albofuscata, P. fuscolutea, Profunditerebra poppei, and Maculauger minipulcher were defined — as those appearing in the subtree of a different genus. Each was further validated by BLAST searches, which confirmed their true genus assignments (Table I). Pruning these six accessions (while preserving branch lengths) from each locus’s gene tree and re‑concatenating the resulting trees, ASTRAL was re‑run to obtain the final, rogue‑free species tree (Figure 2). In this pruned tree, all remaining species fall within their expected genus clades, each supported by high quartet concordance and local posterior (pp1 ≥ 0.95).
Table I. Misplaced species in the raw species tree
| Species name | Location | Blast analysis |
|---|---|---|
| Duplicaria tristis | Sibling species is Pellifronia jungi, low posterior probability: 0.0682 | Blast analysis gives matches with other Duplicaria sp. |
| Duplicaria bernardii | Sibling species are Partecosta sp., Posterior probability: 0.8454 | Blast analysis gives matches with the genus Turridrupa, a genus in the Turridae family |
| Partecosta albofuscata | Sibling species is Partecosta fuscolutea, but both are located in the Myurella subtree. Posterior probability: 0.8537 | Blast analysis gives matches with Duplicaria fuscolutea and Partecosta sp. |
| Partecosta fuscolutea | Sibling species is Partecosta albofuscata, but both are located in the Myurella subtree. Posterior probability: 0.2757 | Blast analysis gives matches with Duplicaria albofuscata and Partecosta sp. |
| Profunditerebra poppei | Sibling species is Punctoterebra arabella. Posterior probability: 0.3987 | Blast analysis gives matches with Neoterebra and Terebra sp. Possible interpretations of this observation are (1) sample swap, cross‑contamination, or mitochondrial introgression, (2) Mitonuclear discordance; could stem from introgression or from a chimeric assembly of loci originating from different individuals. |
| Maculauger minipulcher | Sibling species are Myurellopsis sp. Posterior probability: 0.8661 | Blast analysis gives matches with Punctoterebra and Profunditerebra sp. |
Quartet‐concordance summaries
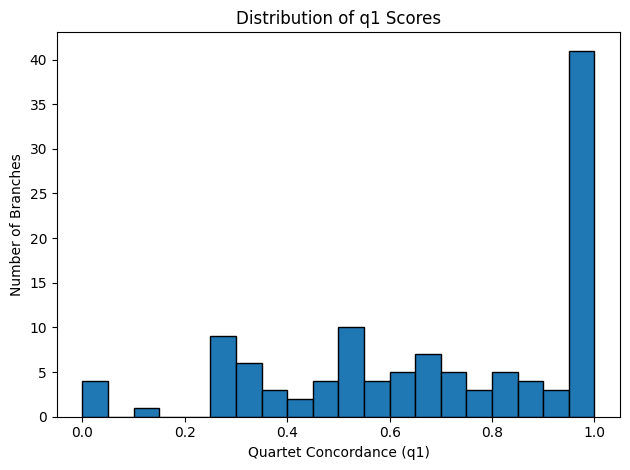
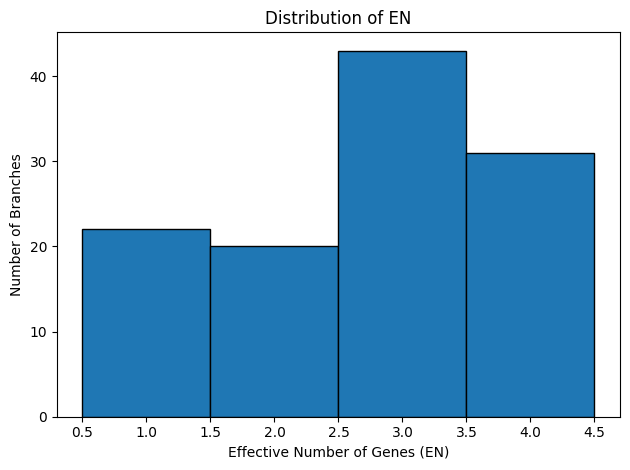
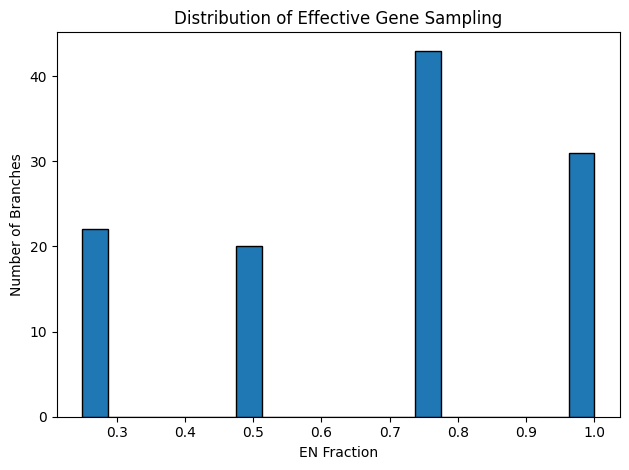
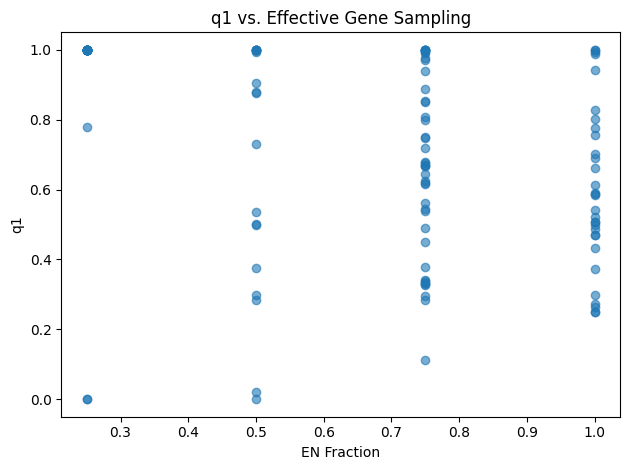
Figure 3: Quartet‐Concordance Summaries. Each panel visualizes one aspect of ASTRAL’s quartet sampling support across all internal branches of the species tree. The far‑left histogram displays the range of primary quartet concordance scores (q1), indicating the proportion of sampled quartets that agree with each branch’s resolution. To its right, a histogram of the effective number of genes (EN) shows how many gene trees contributed informative quartet samples per branch. The third panel converts EN into a fraction of the total loci, highlighting the proportion of genes supporting each split. Finally, the rightmost scatter plot relates q1 to EN fraction, illustrating how quartet concordance varies with the degree of gene sampling.
The quartet‐concordance summaries provide a roadmap for identifying the most reliable branches in our species tree. In Figure 3, the q1 histogram spans the full range of possible values: roughly 29 branches fall below q1 = 0.5, 55 fall below q1 = 0.7, and 72 below q1 = 0.9, indicating varying degrees of quartet support. The EN histogram shows that most nodes draw on three or four gene trees, although a handful rely on only one or two loci. Reframing EN as a fraction of total loci (n = 4) reveals that about 22 branches are informed by fewer than half our genes and roughly 85 by fewer than 80%. Finally, the scatterplot of q1 versus EN‐fraction demonstrates that the strongest quartet‐supported splits (q1 > 0.9) nearly always have high EN‐fraction, whereas low‑q1 branches tend to coincide with poor gene sampling.
The complete tree will be preserved in subsequent analysis, and used to relate the results of the CNN based tree to results described above. By reporting the exact thresholds used, the full transparency and reproducibility is maintained without discarding any data.
Gene Concordance factors
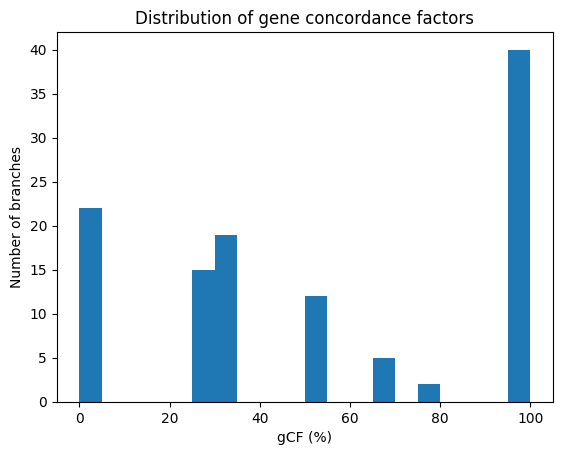
Figure 4: Distribution of gene concordance factors
The concordance factor analysis reveals a tree with a decidedly mixed backbone (Figure 4). The internal branches in the reference tree, the mean gene concordance factor (gCF) is 53% and the median is 50%. In other words, an average split is supported by only about half of the four locus‑specific gene trees. The distribution is strongly bimodal. Approximately forty branches sit at the very top of the scale (gCF ≈ 100%), indicating perfect agreement across loci. At the opposite extreme, ~20 branches fall in the 0–10% bin, where virtually no gene tree recovers the species‑tree split. Minor peaks centred on 25–35% and 50–60% reflect an intermediate tier of moderate agreement. Altogether, 56 branches—nearly half the tree—lie below the 50% concordance threshold, signalling more conflict than support.
Biologically, three classes of edges emerge. First, high‑support/high‑gCF branches (gCF ≥ 80%) define a robust backbone on which almost every gene agrees. Second, branches with strong classical support but low gCF constitute the classic “conflict” category; these splits are likely shaped by incomplete lineage sorting, introgression, or systematic gene‑tree error. Third, edges that are weak under both metrics (low support and low gCF) represent genuinely uncertain relationships that will probably require additional loci or more stringent data filtering to resolve.
Taken together, these patterns highlight a core of concordant relationships flanked by pockets of discordance, underscoring the importance of locus sampling and model choice in reconstructing terebrid phylogeny.
Discussion
The multilocus ASTRAL framework yields a terebrid backbone that is simultaneously coherent and contentious. Concordance‑factor profiling shows a sharply bimodal landscape: one block of branches is supported by virtually every gene (gCF ≥ 80%), whereas nearly half of the internal edges languish below the 50% threshold. Such two‑peaked patterns are common in rapid radiations [4, 5] and reflect the tug‑of‑war between biological signal and stochastic noise.
The persistence of a low‑gCF tail, even on edges that show strong classical support, can be attributed to several factors. First, the family experienced a burst of diversification in the Miocene [4]; under those short internodes, ancestral polymorphisms often fail to sort before successive speciation events, producing the hallmark incongruence of incomplete lineage sorting (ILS) [4, 7]. Second, terebrids are often broadcast spawners with long‑lived larvae, increasing the opportunity for reticulation and introgression among coastal populations; mitochondrial introgression is well documented in other conoideans [8] and would depress gCF while leaving quartet‑based LPP artificially high. Third, our marker set is limited to four traditional loci. Mitochondrial genes, although informative for recent splits, can saturate on deeper branches, whereas ribosomal regions may harbour hidden paralogy or alignment ambiguity [8]. Together these factors create a tug‑of‑war: loci that are individually strong yet mutually discordant.
Methodology also matters. With only four gene trees, a single mis‑rooted or poorly modelled locus can swing the gCF of a branch by ±25%. In addition, the effective number of loci (EN) drops below two for 22 branches, inflating stochastic error and further widening the gap between high‑ and low‑concordance modes.
In practical terms, the high‑gCF backbone (≥80 %) defines a robust core—genus‑level relationships that can be treated as reliable anchors in comparative analyses. By contrast, low‑gCF/high‑support branches are the “conflict zone.” They pinpoint clades where future work should focus on denser genomic sampling (e.g. ultraconserved elements or exon capture) and explicit tests for reticulation. Finally, edges that score poorly on both support and gCF are best regarded as provisional; they may dissolve entirely once dozens of loci are brought to bear.
Pruning the six demonstrably mis‑assigned accessions (Duplicaria tristis, D. bernardii, Partecosta albofuscata, P. fuscolutea, Profunditerebra poppei and Maculauger minipulcher) produced an improvement in tree quality. Generic monophyly, which had been violated in four separate clades of the un‑pruned topology, was fully restored, and local posterior probabilities on the nodes neighbouring each rogue increased. This result mirrors patterns seen in other empirical phylogenomic studies: removing a handful of unstable terminals often resolves large polytomies and boosts branch support across the tree [10].
Our approach was targeted pruning—rogues were flagged a priori because they nested in the subtree of another genus and often failed BLAST validation. Automated rogue‑taxon algorithms such as RogueNaRok [10] reach the same end by iteratively dropping taxa that depress overall support. In benchmark datasets, automated methods usually eliminate 1–5% of terminals, a figure strikingly close to the 4.8 % (6/125) removed here. That concordance suggests our manual cull captured the principal sources of topological noise.
The nature of rogue behaviour differs among the six accessions once each marker is examined in isolation (table I).
- Partecosta albofuscata and P. fuscolutea yield fully concordant placements for every sequence available — COX1 and 16S (both mitochondrial) as well as 28S (nuclear). Such consistency points to a curatorial issue — mis‑labelling of museum lots or unresolved synonymy within Partecosta — rather than to PCR artefacts or introgression.
- Profunditerebra poppei tells a different story: its only available marker, COX1, clusters robustly with Neoterebra in both maximum‑likelihood and Bayesian analyses, matching the top BLAST hits, yet the taxon lacks any nuclear data. This single‑locus displacement typifies the “rogue‑by‑contamination” pattern [10] , where a stray mitochondrial amplicon pulls an otherwise unsampled species into the wrong genus.
- Duplicaria bernardii, D. tristis and Maculauger minipulcher exhibit true mito‑nuclear discordance. Nuclear 28S sequences place each taxon in its morphologically expected genus, but mitochondrial markers (COX1 and/or 16S) nest them elsewhere, and this conflict is reproduced across independent accessions. Recurrent, marker‑specific displacement of this kind is the classic footprint of historical mitochondrial capture—introgressive replacement of the native mtDNA — rather than of label error or chimeric PCR [8].
A denser taxon sample will almost certainly reshuffle the rogue list. Expanding the ~300 terebrid species that still lack sequence data could reveal new problem terminals — especially within the species‑rich clades Terebra and Punctoterebra. For that reason an iterative workflow is proposed: run an initial tree, flag outliers with quartet concordance and leaf‑stability scores, prune or relabel as warranted, then re‑estimate the species tree. Repeated cycles of diagnosis and refinement progressively stabilise the backbone while recording the provenance and justification for every taxon that is removed or reclassified.
In sum, the six‑taxon cull in this study exemplifies the power and prudence of targeted rogue pruning: it restores generic monophyly, sharpens support for neighbouring nodes, and aligns the molecular phylogeny with morphological expectations—without discarding large swaths of data or masking biologically meaningful conflict.
Our reference tree relies on just four loci — three mitochondrial fragments (COX1, 12S, 16S) and a single nuclear ribosomal gene (28S). Even after curation, only 58 % of the 125 species possess sequence data for all four genes, and 22 internal branches are informed by fewer than two gene trees (EN < 2). Such uneven locus coverage is not merely an aesthetic concern: simulation and empirical work show that missing data can deflate support, distort concordance factors and misplace long, well‑sampled branches when the matrix is highly heterogeneous [12]. The problem is magnified by our reliance on GenBank, where deposition patterns strongly favour barcoding genes, leaving many terebrid lineages represented by a single mitochondrial fragment.
High‑throughput target‑enrichment now routinely recovers hundreds to thousands of orthologous nuclear loci. Faircloth et al. [14] introduced the ultraconserved‑element (UCE) approach for birds, and modified probe sets have since proved portable across disparate molluscan clades. For conoidean gastropods, Abdelkrim et al. [13] designed a probe kit that captures 2 649 exons across the superfamily, including several terebrid representatives. Applying that or a terebrid‑specific bait set would let us test whether the low‑gCF edges in our four‑locus tree stem from biological discordance (ILS or introgression) or from marker choice and missing data.
When fresh tissue is unavailable, genomic skimming — low‑coverage, short‑read sequencing of powdered shell or ethanol‑fixed material — offers a cost‑effective alternative. Recent work retrieved complete mitogenomes and high‑copy nuclear rDNAs from Indo‑Pacific cone‑shells up to 60 years old using <1 Gbp of Illumina data per specimen [15]. Although still mitogenome‑heavy, such datasets provide an order‑of‑magnitude more informative sites than single‑gene barcodes and can be generated inexpensively for hundreds of museum vouchers, greatly expanding both gene and taxon coverage. Because many UCE loci reside in moderately repetitive regions, skim reads can also recover partial UCEs, enabling hybrid pipelines in which capture data from a few exemplars are “topped up” by skims from rare taxa.
The missing‑data pattern is strongly asymmetric: COX1 is present for 97 % of taxa, but 28S for only 41 %. Branches subtended by poorly sampled species therefore lean heavily on mitochondrial signal, which is more prone to introgression and substitutional saturation at deeper nodes. Until a richer nuclear backbone is available, subtle patterns — such as the mito‑nuclear discordance seen in Duplicaria — may be exaggerated or obscured by this gradient. Future projects should aim for balanced locus recovery, ideally by piloting a capture probe set across the full taxonomic span of Terebridae and iteratively refining bait coverage.
Our four‑locus synthesis provides a serviceable scaffold, but its conflict profile is inseparable from the constraints of Sanger‑era data and uneven locus sampling. Target‑capture phylogenomics and genomic skimming offer a clear path to higher resolution and more robust concordance measures, while simultaneously mitigating the taxon‑specific biases inherent in public‑sequence mining. Investing in such data will be essential for a fully resolved—and biologically interpretable—Terebridae phylogeny.
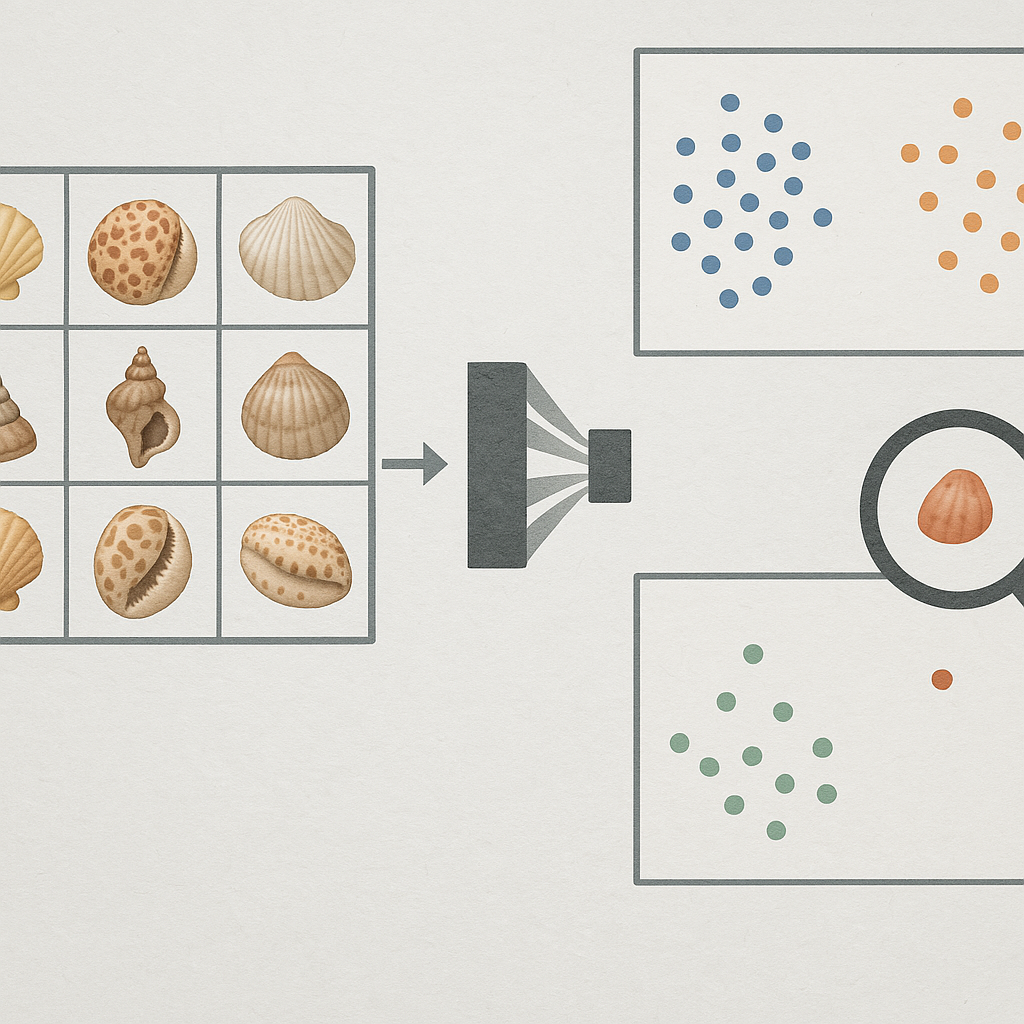
Our immediate objective is to juxtapose the multilocus backbone presented here with a topology inferred by a convolutional neural network (CNN) trained on shell images. Topological congruence with Robinson–Foulds and quartet distances will be measured and examined whether the CNN recovers the high‑gCF scaffold identified in our molecular tree, and flag branches where the two approaches disagree — especially those already characterised by low concordance factors or mito‑nuclear conflict.
References
- [1] Ph. Kerremans Technical Report: Gene phylogenetic tree of Terebridae based on Cox1. Identifyshell.org (2025)
- [2] Ph. Kerremans Technical Report: Phylogenetic Analysis of the ribosomal DNA genes: 12s, 16s, 28s. Identifyshell.org (2025)
- [3] Zhang, C et al. ASTRAL-III: Polynomial Time Species Tree Reconstruction from Partially Resolved Gene Trees. BMC Bioinformatics 19 (S6): 153 (2018)
- [4] J. H. Degnan, N. A. Rosenberg. Gene tree discordance, phylogenetic inference and the multispecies coalescent. Trends in Ecology & Evolution, Volume 24, Issue 6, Pages 332-340 (2009)
- [5] E D. Jarvis et al. Whole-genome analyses resolve early branches in the tree of life of modern birds. Science 346,1320-1331 (2014)
- [6] Modica, M. V., Gorson, J., Fedosov, A. E., et al. Macroevolutionary analyses suggest that environmental factors, not venom apparatus, play key role in Terebridae marine snail diversification. Systematic Biology 69 (3): 413–430 (2020)
- [7] Maddison W.P. Gene trees in species trees. Systematic Biology 46: 523–536 (1997)
- [8] Andrew W. Wood, Thomas F. Duda. Reticulate evolution in Conidae: Evidence of nuclear and mitochondrial introgression. Molecular Phylogenetics and Evolution, Volume 161, 107182 (2021)
- [9] Philippe H et al. Resolving difficult phylogenetic questions: why more sequences are not enough. PLOS Biology 9: e1000602 (2011)
- [10] Aberer AJ, Krompass D, Stamatakis A. Pruning rogue taxa improves phylogenetic accuracy: an efficient algorithm and webservice. Syst Biol. 2013 Jan 1;62(1):162-6. (2013)
- [11] Mai, U., Mirarab, S. TreeShrink: fast and accurate detection of outlier long branches in collections of phylogenetic trees. BMC Genomics 19 (Suppl 5), 272 (2018)
- [12] Zhenxiang Xi, Liang Liu, Charles C. Davis The Impact of Missing Data on Species Tree Estimation. Molecular Biology and Evolution, Volume 33, Issue 3, Pages 838–860 (2016)
- [13] J Abdelkrim et al. Exon-Capture-Based Phylogeny and Diversification of the Venomous Gastropods (Neogastropoda, Conoidea). Molecular Biology and Evolution 35 (10), pp.2355-2374 (2018)
- [14] Faircloth BC et al. Ultraconserved elements anchor thousands of genetic markers spanning multiple evolutionary timescales. Syst Biol. 61(5):717-26 (2012)
- [15] Martin-Roy R et al. Advancing responsible genomic analyses of ancient mollusc shells. PLoS ONE 19(5): e0302646 (2024)
Appendix
Figure 1: Raw Species Tree
Figure 2: Clean Species Tree
