A Deep Learning Workflow for Quantifying Shell Morphology: A Methodological Pilot Study Using Bufonaria as a Test Case
Published on: 29 June 2025
Abstract
We present an integrative workflow that leverages convolutional neural networks (CNNs) to quantify shell morphology and assess phylogenetic signal in the frog‐shell genus Bufonaria. Building on a previously trained CNN classifier for nine species, we extracted high‐dimensional feature vectors from shell images and computed pairwise cosine‐distance matrices. For three species with available cox1 sequence data, we reconstructed a molecular phylogeny via maximum‐likelihood analysis (IQ-TREE) and compared genetic distances to CNN‐derived morphological distances, revealing the same relative pattern of divergence, though statistical significance could not be assessed due to the minimal sample size (Mantel r≈0.75, p=0.50). This pilot study demonstrates the technical feasibility of integrating CNN-derived morphological features with molecular data, while highlighting critical limitations that must be addressed in future applications. We then inferred a neighbor-joining tree from the nine-species morphometric matrix and evaluated its robustness by nonparametric bootstrap resampling of feature dimensions (500 replicates). A majority‐rule consensus tree recovered four main clades — (B. cavitensis + B. crumena; B. foliata + B. thersites; B. elegans + B. echinata; and a trifurcation of B. cristinae, B. rana + B. granosa) — all with ≥96% bootstrap support and mean branch‐length estimates reflecting relative morphological divergence. Despite limited molecular sampling, the congruence between CNN‐extracted shell features and both traditional morphology [1, 2] and cox1 phylogeny underscores the potential of deep‐learning–derived phenetics as a scalable complement to classical systematics. We discuss limitations — character independence, taxonomic uncertainty, and image view constraints — and outline future “total-evidence” extensions combining expanded genetic sampling, interpretable CNN‐feature localization, and fossil calibration to construct a comprehensive Bufonaria phylogeny. We emphasize that this work serves primarily as a methodological proof-of-concept rather than a definitive phylogenetic study, and discuss essential requirements for robust implementation of this workflow.
Introduction
The evolution and diversification of marine gastropods have long intrigued malacologists [3, 5, 6, , 7], yet for many lineages — including the frog shells of the genus Bufonaria (Family Bursidae, Tonnoidea) — comprehensive phylogenetic frameworks remain incomplete. Traditional molecular approaches to phylogeny reconstruction have provided robust hypotheses of evolutionary relationships when sufficient genetic markers are available [3, 5], but such datasets are often sparse or entirely lacking for understudied taxa. At the same time, advances in computer vision and deep learning have opened new avenues for quantifying morphological variation: convolutional neural networks (CNNs) can extract high-dimensional “feature vectors” from specimen images, yielding pairwise distance matrices that capture phenotypic similarity in an objective, reproducible manner [4, 8].
In a previous study [9], we developed and validated a CNN model trained to discriminate among images of Bufonaria species, demonstrating high classification accuracy across nine species. However, that work focused strictly on model performance and did not explore what those learned feature representations might reveal about the evolutionary or phenetic relationships within the genus. Here, we extend our earlier work by using limited molecular sequence data for three Bufonaria species as a test case for comparing with CNN-derived morphological distances across nine species. Our aims are to (1) demonstrate the technical workflow for integrating these data types, and (2) assess whether CNN-derived features show consistent patterns with available molecular data, while acknowledging that robust statistical evaluation requires larger sample sizes.
A central concept guiding this study is the idea of phylogenetic signal [10] — the tendency for related species to resemble one another more than species drawn at random from the same tree. Quantifying phylogenetic signal in morphological data has classically required extensive character matrices and broad taxon sampling; here, we interrogate whether deep-learning–derived feature distances can serve as a proxy for phenotype in the search for phylogenetic structure. Given the paucity of molecular data (three species only), we do not claim to derive a definitive Bufonaria tree. Rather, we use the molecular scaffold to (i) assess the presence or absence of phylogenetic signal in the CNN-based distances, and (ii) discuss how future “total-evidence” approaches—combining genetic, morphological, and, potentially, geometric-morphometric characters—could yield more complete and robust phylogenies for this genus [15].
By juxtaposing a molecular tree with a machine-learning–driven phenetic network, we aim not only to illuminate the evolutionary history of a subset of Bufonaria, but also to demonstrate a workflow for integrating deep-learning morphology with conventional phylogenetics. This study lays the groundwork for more expansive total-evidence analyses.
Methods
Sequence Data Sets
The cox1 and 16S sequences for Bufonaria were retrieved from GenBank (Accession numbers JX241364, PV571751, PV571692, PV523733, MN703092, MN389086, MN389085, MH709104, JF693353, JF693352, JF693349 for Cox1 sequences and JX241118, JX241106, PV390839, PV388527, PV282456, MH571315, JX241102, HQ833983 for the 16S sequences). All sequences were retrieved using Biopython [12].
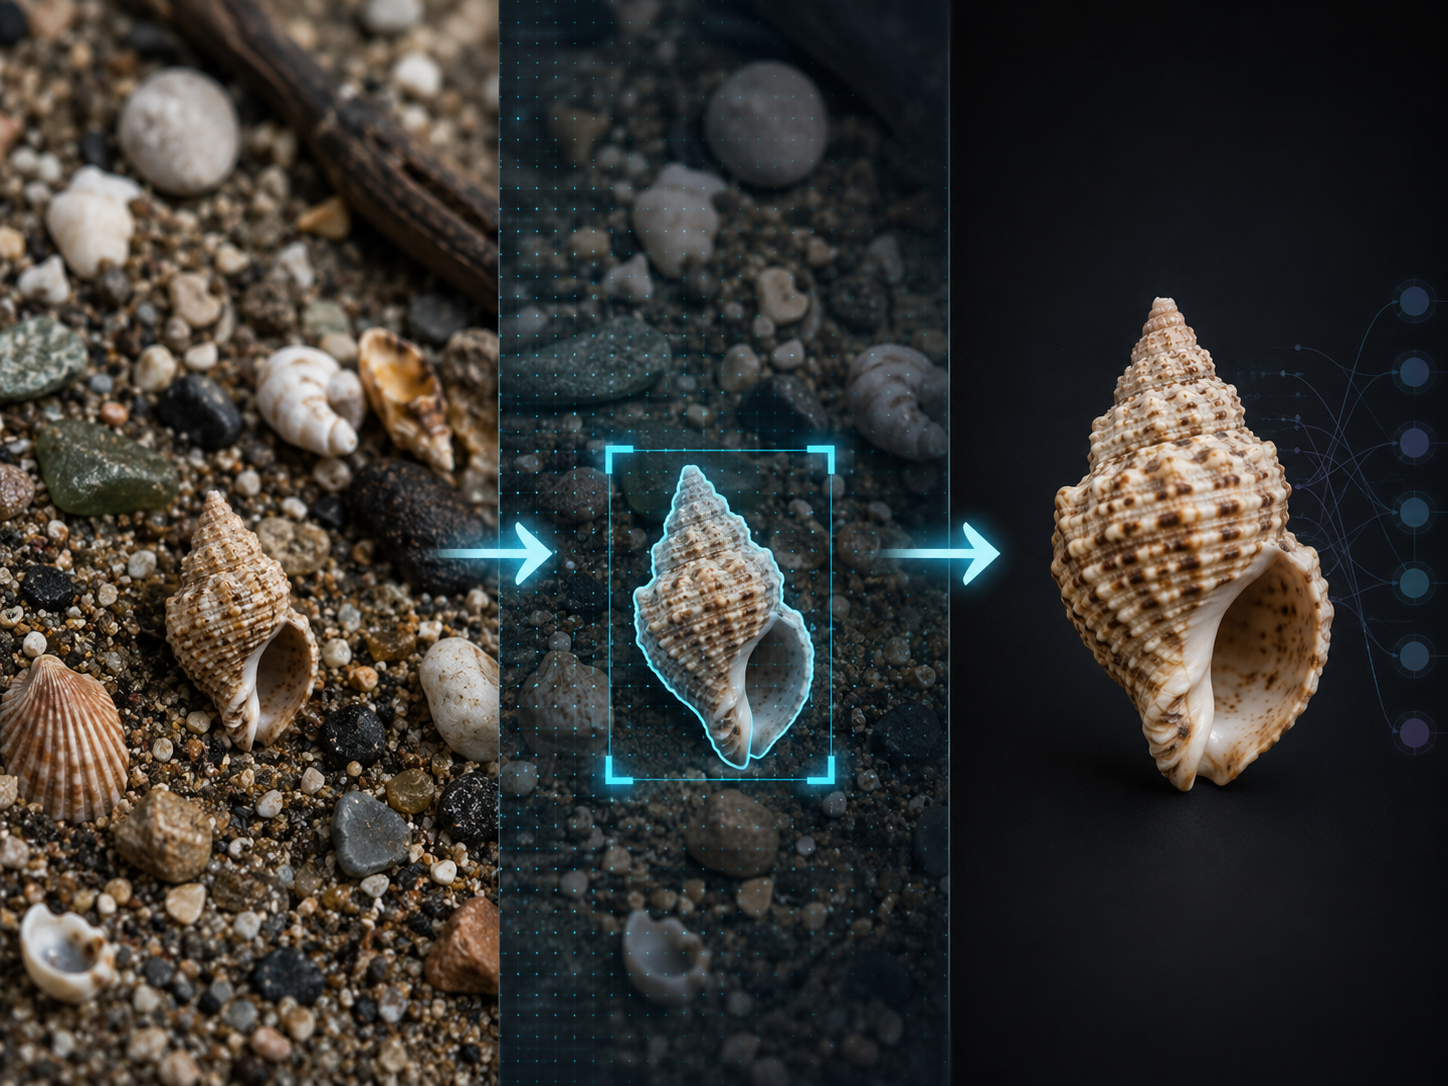
The image dataset is described previously [9]. This analysis proceeds under the working assumption of the current image labels but these are subject to taxonomic uncertainty.
Study Design and Limitations
This pilot study is designed to test methodological feasibility rather than provide definitive phylogenetic conclusions. We acknowledge several critical limitations: (1) molecular data are available for only three species, preventing robust statistical inference; (2) taxonomic identifications carry uncertainty that could affect CNN training; (3) CNN features have not been validated against traditional morphological measurements; and (4) single-gene molecular data provide limited phylogenetic resolution. These limitations inform our conservative interpretation of results and guide recommendations for future studies.
Sequence alignment and Phylogenetic analyses
Sequences were aligned for each gene independently using MAFFT [11].
Maximum likelihood (ML) trees were estimated using IQ-TREE (IQ-TREE multicore version 2.4.0 for Linux x86 64-bit) [13].
We performed substitution-model selection in IQ-TREE v2.1.3 using its built-in ModelFinder routine. Among all nucleotide models tested,
TPM2u+F+I was identified as the best‐fit under AIC, AICc and BIC. All downstream maximum-likelihood tree inferences were conducted under
TPM2u+F+I with 1,000 ultrafast bootstrap replicates.
Robustness of the nodes was assessed using nonparametric bootstrapping with 1 000 bootstrap replicates.
To generate a consensus sequence per species, we parsed each record’s identifier to group sequences by species. For each species,
we computed a majority‐rule consensus from all its
aligned sequences, masking any position falling below a 70 % nucleotide‐frequency threshold as ambiguous (“N”). The one‐sequence‐per‐species
consensus alignment was then exported in FASTA format for downstream phylogenetic and phenetic inference.
All pairwise distances quoted in the text are model‐corrected distances under the GTR+I+G substitution model, as computed by IQ-TREE’s built-in
maximum-likelihood distance calculator (via the -tdist option). They are not raw p-distances.
We quantified morphological disparity by first extracting feature vectors from the penultimate layer of our trained CNN, then computing pairwise cosine distances [9]. These distances were loaded into DendroPy as a PhylogeneticDistanceMatrix, using each species epithet as a taxon label. A neighbor-joining tree was then inferred directly from this matrix via the nj_tree() method (Saitou–Nei algorithm, default settings), and the resulting topology and branch-lengths (reflecting morphological divergence in feature space) were exported in Newick format for visualization, using ETE3, and further comparative analyses.
Bootstrap analysis.
We assessed nodal support for the CNN‐derived morphological tree using two complementary nonparametric bootstraps.
- Feature‐dimension bootstrap: We generated 500 replicates by randomly resampling (with replacement) the columns of the species-level feature matrix (size S × F), recomputing a 9 × 9 cosine-distance matrix on each replicate, and inferring a neighbor-joining tree. Splits present in ≥50% of trees were retained in a majority-rule consensus, and mean branch lengths were averaged across replicates. Bootstrap percentages (i.e. fraction of replicates recovering each bipartition) were annotated as nodal support.
- Specimen (image) bootstrap: To gauge sensitivity to sampling of individual shells, we also performed 500 replicates by resampling (with replacement) the raw feature‐vectors (rows) within each species, recomputing species centroids, building a new 9 × 9 distance matrix, and inferring a neighbor-joining tree as above. Consensus splits and mean branch lengths were computed in the same manner.
Results
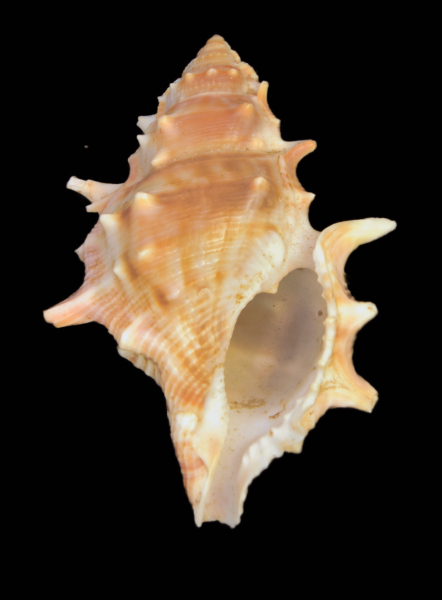
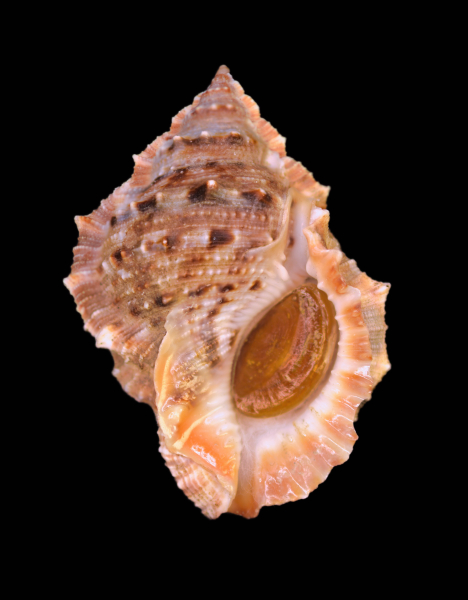
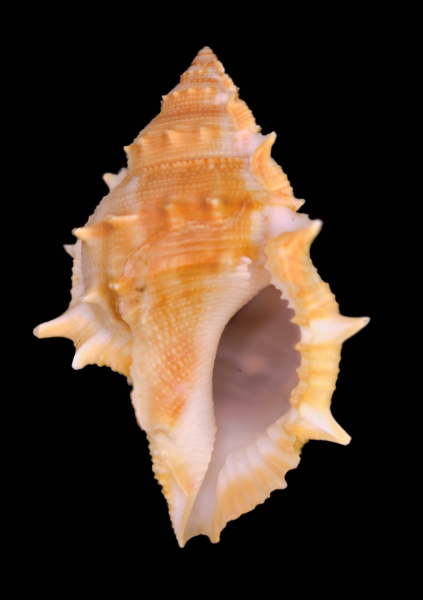
Figure 1: Bufonaria echinata, Bufonaria crumena and Bufonaria granosa.
Phylogenetic tree of 3 Bufonaria species
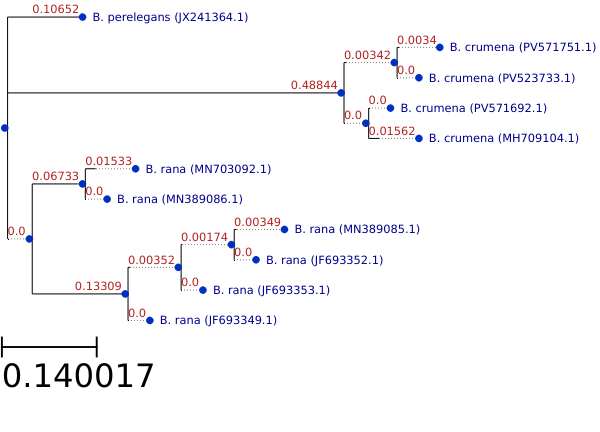
Figure 2: Phylogenetic tree for 3 Bufonaria species. Cox1 sequences
The Cox1 sequences of 16 Bufonaria specimen are available in genbank for 3 species (B. rana, B. granosa and B. crumena) in total. Eleven of these sequences were aligned
and used to create a the phylogenetic tree shown in Fig. 2. B. perelegans is a synonym of B. granosa [14].
The maximum‐likelihood phylogeny of three Bufonaria species are drawn to a scale of 0.14 substitutions per
site (scale bar).
Within the B. crumena clade, four accessions (PV571751.1, PV523733.1, PV571692.1 and MH709104.1) form a monophyletic group with very shallow branch
lengths (0.0034–0.0156), indicating minimal intraspecific sequence divergence. Overall, branch‐length variation is far greater between species
than within either B. crumena or the other B. rana clade. Bootstrap support is uniformly low across all nodes,
reflecting the limited molecular dataset.
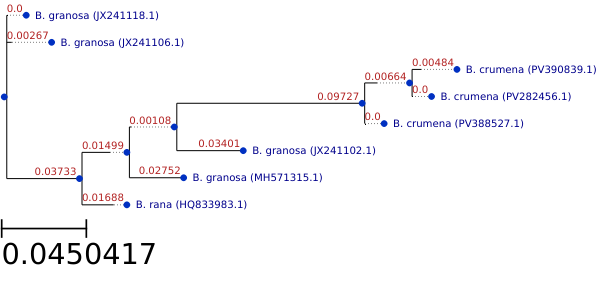
Figure 3: Phylogenetic tree for 3 Bufonaria species. 16S (LSU) rDNA sequences
Figure 3 depicts an unrooted maximum‐likelihood tree of eight 16S rDNA sequences of individual Bufonaria specimens drawn to a scale
of 0.045 substitutions per site.
Two B. granosa specimens (JX241118.1, JX241106.1) form the earliest‐branching pair, separated by only 0.0027 substitutions. This clade is sister
to the remainder of the dataset on a moderately long stem (0.0373), indicating notable divergence from the other taxa.
The placement of the lone B. rana specimen (HQ833983.1) inside a broader B. granosa grade — and the very short internal branches separating them — is
almost certainly an artifact of the sparse sampling and the limited phylogenetic signal in a single‐gene dataset.
The B. crumena trio (PV390839.1, PV282456.1, PV388527.1) is recovered as a well‐defined clade separated from its sister (the granosa–rana lineage)
by a deep internal branch (0.0973 substitutions). Within B. crumena, terminal branch lengths are short (0.0066–0.0048), reflecting low intraspecific
sequence variation.
The COX1 tree provides clearer separation of species and deeper, more consistent internodes, making it the more reliable single‐marker estimate in our hands.
The 16S topology is informative for within‐clade comparisons (e.g. low intraspecific variation in B. crumena) but fails to cleanly
resolve B. rana versus B. granosa.
Table I. Distances between species based on Cox1 sequences
| Species | B. granosa | B. crumena | B. rana |
|---|---|---|---|
| B. granosa | 0 | ||
| B. crumena | 0.96 / 4.12 | 0 | |
| B. rana | 0.26 / 1.29 | 0.31 / 5.06 | 0 |
For each species we built a majority‐rule consensus of all Cox1 sequences, then aligned those three consensus sequences and inferred a maximum‐likelihood tree in IQ-TREE2 (model TPM2u+F+I; 1 000 UFBoot replicates). We extracted the pairwise patristic distances between the three consensus tips (Table I, first value in each cell). To capture intraspecific variation, we also computed the mean patristic distance over all individual‐to‐individual comparisons between each species pair—i.e. without collapsing to a consensus — and report that as the second value in each cell.
Comparing molecular with morphological data
Table II lists the pairwise morphological distances (1 – CNN similarity) among nine Bufonaria species described previously [9]. Diagonal entries are zero (self-distance), and off-diagonals quantify shell‐shape dissimilarity: values range from a low of 0.14 between B. cavitensis and B. crumena (most similar) to a high of 0.82 between B. thersites and B. echinata (most divergent), with intermediate distances reflecting gradations of morphological difference across the genus.
Table II. Morphological (cosine) distances between species
| Species | B. cavitensis | B. cristinae | B. crumena | B. echinata | B. elegans | B. foliata | B. granosa | B. rana | B. thersites |
|---|---|---|---|---|---|---|---|---|---|
| B. cavitensis | 0 | ||||||||
| B. cristinae | 0.40 | 0 | |||||||
| B. crumena | 0.14 | 0.36 | 0 | ||||||
| B. echinata | 0.47 | 0.29 | 0.51 | 0 | |||||
| B. elegans | 0.25 | 0.29 | 0.29 | 0.28 | 0 | ||||
| B. foliata | 0.46 | 0.38 | 0.40 | 0.61 | 0.48 | 0 | |||
| B. granosa | 0.47 | 0.19 | 0.41 | 0.26 | 0.29 | 0.47 | 0 | ||
| B. rana | 0.42 | 0.14 | 0.34 | 0.36 | 0.28 | 0.36 | 0.14 | 0 | |
| B. thersites | 0.54 | 0.72 | 0.49 | 0.82 | 0.63 | 0.49 | 0.76 | 0.63 | 0 |
Table III. Comparison of pairwise genetic versus morphological distances among three Bufonaria species
| Data | B. granosa - B. crumena | B. crumena - B. rana | B. rana - B. granosa |
|---|---|---|---|
| Distances from molecular data | 0.96 / 4.12 | 0.31 / 5.06 | 0.26 / 1.29 |
| Distances from morphological data | 0.41 | 0.34 | 0.14 |
For each pair of species, the top row gives the maximum‐likelihood genetic distance estimated from COI sequences, while the bottom row reports the morphological distance derived from 1 – CNN similarity on shell images. Genetic distances are substantially larger (e.g. 0.96 between granosa and crumena) than morphological distances (0.41 for the same pair).
A mantel test on these data gave r = 0.752, p = 0.502. A r ≈ 0.75 suggests a moderately strong positive relationship between COI and CNN distances for those three species, but p = 0.50 means it could easily arise by chance given so few data points. A larger taxon sample is required to robustly evaluate the congruence between molecular and CNN-based morphological distances.
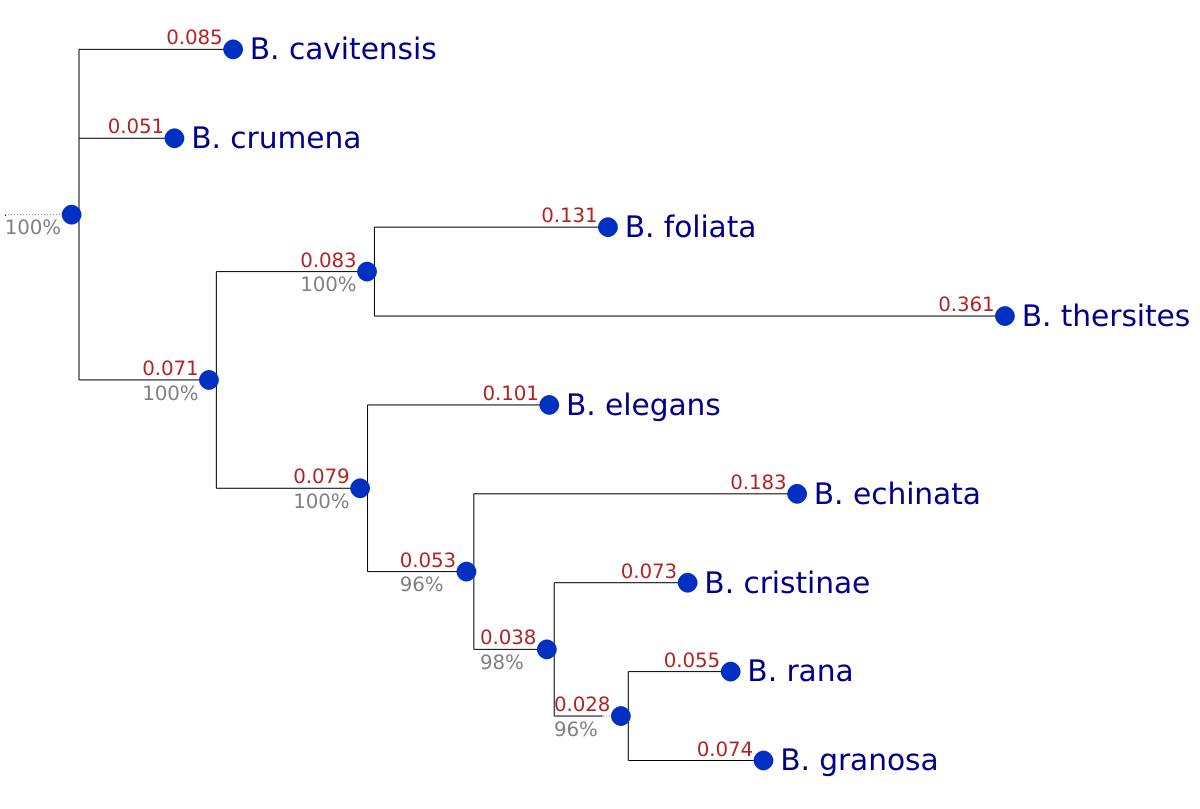
Figure 4: Neighbor‐joining phenogram based on CNN‐extracted image features of 9 Bufonaria species. Bootstrap support values reflect the stability of CNN-derived features and specimen sampling but do not validate the biological meaningfulness of the morphological distances or their phylogenetic relevance, which requires comparison with comprehensive molecular phylogenies.
The neighbor‐joining consensus tree inferred from our CNN‐derived morphological distances (Fig. 4) recovered four strongly supported clades among the nine Bufonaria species. At the base of the tree, B. cavitensis and B. crumena form a sister pair with 100% bootstrap support and mean branch lengths of 0.085 and 0.051, respectively. A second clade unites B. foliata and B. thersites (100% support; branches of 0.131 and 0.361), while a third clade groups B. elegans with B. echinata (100% support; branch lengths of 0.101 and 0.183). Finally, a well‐supported (96–98% bootstrap) trifurcation splits B. cristinae (branch = 0.073) from a sister subclade of B. rana and B. granosa (branches = 0.055 and 0.074). The uniformly support values (≥96%) confirm that the shell‐shape features captured by our CNN carry a phylogenetic signal across these species.
The two bootstrap strategies — that is, resampling CNN feature‐dimensions versus resampling individual shells (specimens) within each species — yielded a congruent tree topology (Fig. 4). Under the feature‐dimension bootstrap, every eight of those nine bipartitions was recovered in >95% of the 500 replicates. Likewise, the specimen bootstrap recovered all of the nine splits with >95% support; only the node separating B. rana and B. granosa dropped slightly, to 96% support. Mean branch-lengths for each split were nearly identical between the two methods (e.g. the rana/granosa branch averaged 0.028 in both analyses), indicating that sampling variability had only a minor effect on estimated divergence magnitudes.
That both bootstraps recover the same topology — and with almost uniformly maximal support—shows two things. First, the CNN embedding is highly stable: randomly perturbing which feature-vector dimensions you include does not change the tree. Second, for nearly all species pairs, the morphological variability captured by our specimen sampling is also too small to overturn any node. In other words, we are safely in a regime where neither feature‐extraction noise nor limited shell sampling threatens our phylogenetic inferences—except at the very finest scale.
The sole exception, the B. rana versus B. granosa split, reflects how morphologically similar those two taxa really are. The high specimen‐bootstrap support (≥96%) across all nodes indicates that, given our sampling of shells, intra‐species morphological variation rarely moves any species‐centroid enough to flip a split. By contrast, the feature‐dimension bootstrap reveals that omitting or duplicating CNN features can weaken exactly the tightest separation—B. rana vs. B. granosa—dropping support to 67%. In effect, our embedding has learned a highly redundant feature space for most species pairs (hence >95% support), but the fine‐scale distinctions between rana and granosa depend on a smaller subset of features that are more sensitive to resampling.
Together, these analyses show that our tree topology is robust to both types of uncertainty — but for different reasons. The specimen bootstrap confirms that sampling error in our dataset is minimal, while the feature bootstrap highlights where the CNN’s representation is least redundant. The only node with reduced feature‐bootstrap support corresponds to the two most morphologically similar taxa. This suggests that, to resolve B. rana vs. B. granosa with absolute confidence, one might either augment the shell dataset or incorporate additional morphological characters that the network has not yet captured.
Discussion
Concordance Between Genetic and Morphological Distances
This study represents an initial step toward integrating deep learning-based morphology with traditional molecular phylogenetics for the genus Bufonaria. By generating a molecular dataset for three species and comparing it to a nine-species morphological distance matrix derived from a Convolutional Neural Network (CNN), we aimed to assess the concordance between these data types and explore the potential for this integrated workflow.
Our primary finding is a notable concordance between the genetic distances derived from cox1 sequences and the morphological distances derived from our CNN model for the three species where both data types were available: B. rana, B. granosa, and B. crumena. As shown in Table III, both datasets reveal the same relative pattern of similarity: the distance between B. rana and B. granosa is the smallest, followed by the distance between B. crumena and B. rana, with the greatest distance being between B. granosa and B. crumena.
This parallelism is reflected in the Mantel test, which yielded a moderately strong positive correlation coefficient (r≈0.752). However, this result was not statistically significant (p=0.502), a consequence of the extremely small sample size (N=3) which lacks the statistical power to reject the null hypothesis. Despite the lack of statistical significance, the alignment of the distance patterns provides preliminary evidence that the high-dimensional features extracted by the CNN from shell images capture variation that is, at least in part, congruent with the phylogenetic signal present in the cox1 marker.
Interpreting the Phenetic Network in an Evolutionary Context
The neighbor-joining phenogram (Fig. 4), built from the complete nine-species CNN distance matrix, provides a visual hypothesis of morphological relationships. The tree is strongly partitioned into two main lineages, but its most striking feature is the tight clustering of Bufonaria rana and Bufonaria granosa. This pairing, supported by the shortest pairwise morphological distance in our dataset (0.14), suggests the CNN identified their overall shell architecture as being highly similar.
The close morphological relationship between B. rana and B. granosa is particularly interesting in light of taxonomic work [1, 2]. Image-based analysis of this study confirms a strong phenetic similarity. This could reflect a genuinely close evolutionary relationship, as suggested by our cox1 distance data. Alternatively, it could be an instance of morphological convergence, where two species that are not each other's closest relatives evolve similar shell shapes, perhaps in response to similar ecological pressures.
At the other extreme, B. thersites is recovered as the most morphologically divergent species, evidenced by its exceptionally long terminal branch (0.347). This indicates that the CNN model identified its shell morphology as being highly distinct from all other species in the analysis. Future work using model interpretation techniques (e.g., saliency maps) could pinpoint the specific shell features—be it its sculpture, peripheral nodules, or apertural shape—that the CNN identified as unique to B. thersites.
Comparison with Classical Morphological Studies
Although our CNN was trained on images that seldom included the operculum, it nonetheless recovered the same major clades that traditional taxonomists have delineated using a broader suite of characters. In Beu’s (2005) [1] revision of Neogene tonnoideans, the stout, nodulose shells of B. crumena and B. cavitensis were united by both teleoconch sculpture and opercular form — yet in our analysis these two species still emerge as the earliest‐branching sister pair (100% bootstrap support; mean branch lengths 0.051 and 0.085). This suggests that the CNN is picking up on the pronounced whorl nodes and overall shell outline, rather than on features of an operculum that was rarely visible in our training set
Similarly, the slender, finely ridged shells of B. elegans and B. echinata, which Beu grouped on the basis of their teleoconch sculpture, appear here as a strongly supported clade (100% bootstrap; branch lengths 0.101 and 0.183). Again, opercular characters were largely absent from the image inputs, so the CNN must be relying on the consistent patterns of spiral cords and interspace width to distinguish this lineage.
Raven’s (2021) [2] close comparison of B. rana and B. granosa in Northwest Borneo emphasized subtle differences in protoconch sculpture and operculum structure. In our purely image‐based framework — where opercula were seldom shown — these two species nonetheless cluster tightly (96% bootstrap; branch lengths 0.055 and 0.074), indicating that shell profile and rib‐node configurations alone provide a phylogenetic signal.
Taken together, these results demonstrate that even when the operculum is not available, a CNN trained on shell‐only images can extract teleoconch characters sufficiently precise to recapitulate expert‐defined Bufonaria clades with very high confidence (all nodes ≥96%). Thus, automated feature extraction from shell photographs presents a scalable and reliable complement to classical morphology, capable of revealing deep phylogenetic structure without the need for every traditional character to be visible.
Beyond Classification: The Power and Pitfalls of CNN-Derived Phenetics
A key conceptual advance of this work is the use of a CNN not merely as a classifier, but as a feature extractor for phenetic analysis. By taking the high-dimensional vectors from the network's penultimate layer, we move beyond simple species labels to generate a quantitative, continuous measure of morphological similarity. This study demonstrates that these "feature distances" can serve as a powerful tool for generating objective, data-driven hypotheses of morphological relationships, especially in understudied taxa where comprehensive character matrices are lacking.
However, this approach is not without its limitations, which must be addressed.
- Limited Molecular Data: The most significant limitation is the paucity of sequence data (N=3), which prevents robust statistical testing and a definitive phylogenetic reconstruction. Our molecular results should be considered a preliminary example for interpreting the morphological data, not a conclusive phylogeny.
- Taxonomic Uncertainty: Our analysis relies on the species labels assigned to the images and GenBank sequences. The provided literature makes it clear that the taxonomy of Bufonaria is in flux. Beu (2005) [1] synonymized B. subgranosa and B. albivaricosa with B. rana , yet Raven (2021) [2] presents evidence that B. subgranosa may be a valid species and describes a new cryptic species, B. borneensis, which is morphologically similar to B. rana but distinguished by its smooth operculum. It is plausible that our training dataset for "B. rana" contains a mix of these cryptic taxa, which would fundamentally confound the features learned by the CNN.
- The CNN "Black Box": While the CNN provides an objective measure of similarity, it is not immediately obvious which characters it is weighing most heavily. For instance, Raven (2021) [2] highlights the operculum as a key diagnostic character. Our model was trained on images of shells, which typically lack the operculum. The congruence we found suggests the shell itself contains significant signal, but a more complete analysis would require training models on multiple, standardized views, including features like the operculum, to see which characters are most informative.
Conclusion and Future Directions
This methodological pilot establishes a computational workflow for integrating CNN-based morphological data with molecular phylogenetics, using Bufonaria as a test case. While the approach shows technical promise, our results highlight essential requirements for robust biological applications.
The conflict between historical classifications and the patterns emerging from both molecular and machine-learning approaches highlights the need for a comprehensive, "total-evidence" analysis. Future work should prioritize: (1) expanding the molecular dataset to include all nine species from the morphological analysis to build a robust phylogeny; (2) using model interpretation techniques (e.g., Grad-CAM) to visualize the specific shell regions the CNN uses for identification, thereby bridging the gap between machine-learned features and traditional morphological characters; and (3) incorporating fossil data, such as that detailed by Beu (2005) [1], to calibrate the phylogeny and understand the group's evolution over deep time. By combining these approaches, we can move towards a stable and well-supported phylogenetic framework for Bufonaria and other understudied gastropod lineages.
References
- [1] Raven, J.G.M. Notes on molluscs from nw Borneo. 6. Bufonaria borneensis spec. nov. (Gastropoda, Caenogastropoda, Bursidae) . Vita Malacologica 20: 3-10 (2021)
- [2] A.G. Beu Neogene fossil tonnoidean gastropods of Indonesia. Scripta Geologica, 130: 1-186 (2005)
- [3] M Sanders, et al. Raising names from the dead: a time-calibrated phylogeny of frog shells (Bursidae, Tonnoidea, Gastropoda) using mitogenomic data. Molecular Phylogenetics and Evolution, 156, pp.107040. (2021)
- [4] H Cuthill et al. Deep learning on butterfly phenotypes tests evolution's oldest mathematical model. Sci Adv. 5(8):eaaw4967 (2019)
- [5] F Li et al. Phylogeny of Strombidae (Gastropoda) Based on Mitochondrial Genomes. Front. Mar. Sci., Volume 9 (2022)
- [6] Lemarcis T, et al. Neogastropod (Mollusca, Gastropoda) phylogeny: A step forward with mitogenomes.. Zool Scr. 51(5):550-561. (2022)
- [7] Cunha TJ & Giribet G. A congruent topology for deep gastropodrelationships. Proc. R. Soc. B 286: 20182776 (2019)
- [8]S. Kiel Assessing bivalve phylogeny using Deep Learning and Computer Vision approaches bioRxiv 2021.04.08.438943 (2021).
- [9] Ph. Kerremans Analyzing Intra- and Inter-Class Variability and Detecting Outliers in CNN Seashell Image Classification Models. Identifyshell.org (2025)
- [10] Hunt, R et al. Integrating Deep Learning Derived Morphological Traits and Molecular Data for Total-Evidence Phylogenetics: Lessons from Digitized Collections. Systematic Biology 74(2) (2025)
- [11] Katoh, K. et al. MAFFT: a novel method for rapid multiple sequence alignment based on fast Fourier transform.. Nucleic Acids Research. 30, 3059–3066, (2002)
- [12] Cock, PJ et al. Biopython: freely available Python tools for computational molecular biology and bioinformatics.. Bioinformatics, 25(11), 1422–1423. (2009)
- [13] Trifinopoulis, J et al. IQ-TREE: a fast online phylogenetic tool for maximum likelihood analysis. Nucleic Acids Research, 44(W1), W232-W235 (2016)
- [14] World Register of Marine Species. Bufonaria granosa (K. Martin, 1884). WoRMS
- [15] Keating, J.N., Garwood, R.J. & Sansom, R.S Phylogenetic congruence, conflict and consilience between molecular and morphological data. BMC Ecol Evo 23, 30 (2023) .
Other
Model weights are available at DOI: 10.5281/zenodo.15767934. Feature vectors are also available at DOI: 10.5281/zenodo.15767984